
Slow application
You do not know whether the source is SQL, a query or the application itself.
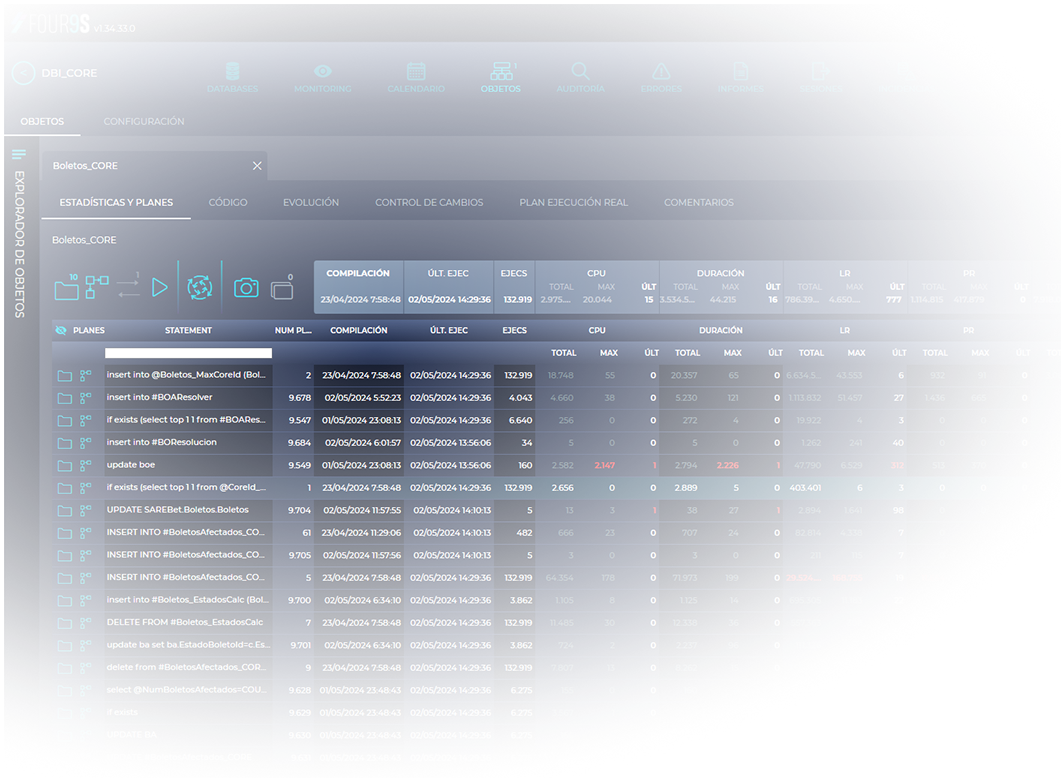
Four9s is an advanced SQL Server observability platform that provides complete, real-time visibility into what is happening in your environments.
Monitor heavily loaded servers with minimal impact. It creates no traces, adds no objects to tempdb and requires no agents on monitored systems.
We also offer a mobile application and, above all, listen to our customers: their feedback helps us build new features and improve existing ones.
You do not know whether the source is SQL, a query or the application itself.
The blocking has disappeared and you do not have enough evidence.
The incident is over, but you need to reconstruct what happened.
CPU, activity or resource usage rises and you need to know why.
You need objective data to identify the source of an incident.
A SQL incident can affect critical processes in your organization.
Know what is happening in SQL at every moment.
Go back and analyze exactly what happened.
Relate SQL activity to system metrics.
Monitor high-load environments without creating traces.
Get the data you need to find the source of the problem.
A solution built for teams that work with SQL.
Four9s provides real-time monitoring of your SQL Server databases, allowing you to identify and resolve performance problems quickly and efficiently.
These features give database administrators visibility into errors that may occur in SQL Server.
This section provides information about disks, each database's impact on system resource usage, current sizes and growth projections.
Database details show the current size of data and indexes, the number of rows in each table and how these values evolve over time.
Drilling into a table reveals valuable information to help DBAs make decisions about index and statistics maintenance, including which database processes use them.
In the Four9s incident panel you will find incidents generated according to the thresholds specified in the configuration. With one click, Four9s takes you to the exact moment when the incident was generated.
These incidents can be integrated for delivery to email, Teams, Jira, Dynatrace, Splunk and other tools.
Compare activity differences across time ranges to quickly discover degraded processes, including new processes that were not previously running.
Answer questions such as: Why was CPU usage 45% during this period? Why is it 45% on Saturdays at 20:00 but 25% on Mondays at the same time? Which processes or queries run more often or have degraded?
Export reports showing the evolution of SQL Server and business counters. If you develop your business databases, auditing can save many hours when a project requires database object changes.